Test Results in ActiveData
Our automated test results are publicly accessible via ActiveData, which allows us to determine areas the need attention. For example, we might want to identify tests that take the longest to run, or tests that fail most often. We can also use ActiveData to see if changing the version of Python or a package has an effect on the duration or outcome of the tests.
Most of our test automation is based on pytest, and in order to these results into ActiveData we need to generate structured logs and upload them to an Amazon S3 bucket. ActiveData scans this bucket, ingests the logs, and the results are then available for querying.
Structured Logs
Many test suites at Mozilla use mozlog to generate structured logs. As ActiveData is already familiar with this format, it makes sense to reuse it for our test results. To achieve this, mozlog includes a simple pytest plugin named pytest-mozlog. When mozlog is installed, additional command line options are added to pytest for generating logs in the various available formats. For example, to generate a structured log:
pytest --log-raw=raw.log
Other formats are available, however the raw format is the only one that ActiveData will be able to process. Here’s an example of the output:
{"pid": 92739, "run_info": {"Python": "2.7.10", "Plugins": {"mozlog": "3.4", "xdist": "1.15.0", "base-url": "1.3.0", "metadata": "1.3.0", "html": "1.14.2"}, "Packages": {"pytest": "3.0.6", "pluggy": "0.4.0", "py": "1.4.32"}, "Platform": "Darwin-16.4.0-x86_64-i386-64bit"}, "action": "suite_start", "tests": ["test_foo.py::test_foo", "test_bar.py::test_bar"], "component": "pytest", "source": "pytest", "time": 1489585066381, "thread": "MainThread"}
{"pid": 92739, "test": "test_foo.py::test_foo", "action": "test_start", "component": "pytest", "source": "pytest", "time": 1489585071631, "thread": "MainThread"}
{"pid": 92739, "test": "test_bar.py::test_bar", "action": "test_start", "component": "pytest", "source": "pytest", "time": 1489585071631, "thread": "MainThread"}
{"status": "PASS", "pid": 92739, "test": "test_foo.py::test_foo", "action": "test_end", "component": "pytest", "source": "pytest", "time": 1489585072217, "thread": "MainThread"}
{"status": "PASS", "pid": 92739, "test": "test_foo.py::test_bar", "action": "test_end", "component": "pytest", "source": "pytest", "time": 1489585072219, "thread": "MainThread"}
{"pid": 92739, "action": "suite_end", "component": "pytest", "source": "pytest", "time": 1489585072594, "thread": "MainThread"}
Metadata
In order to add context to the results we use the
pytest-metadata plugin. This
adds details on the platform, Python binary, pytest packages, and pytest
plugins used in the test session. It also adds environment variables from
several continuous integrations servers, and we use this to associate results
with a specific application under test. All of this data is added to the
run_info in the suite_start message within the structured log.
Querying ActiveData
You can use the ActiveData Query Tool to run queries and see the responses from ActiveData. The getting started guide is a good place to start, however let’s explore a couple of examples.
Test Durations
The following query will return the 90th percentile for test duration, grouped by test name and job:
{
  "from":"fx-test",
  "limit":1000,
  "groupby":["test.full_name"],
  "select":[{
    "aggregate":"percentile",
    "percentile":0.9,
    "value":"result.duration"
  }]
}
You’ll need to sort the results in the client to determine the longest running tests. Then you may want to do further queries to learn if these tests are longer against different environments, or across the board. This might highlight tests that are doing too much, or at least slowing down the feedback loop.
Failing Tests
The following query will return the total number of times each test has failed.
{
  "from":"fx-test",
  "limit":1000,
  "groupby":["test.full_name"],
  "where":{"eq":{"result.ok":false}},
  "select":[{"aggregate":"count"}]
}
Note that this doesn’t distinguish between the various outcomes that evaluate as a failure, so this is just wherever the outcome does not match the expectation.
Plotting Results
A useful way to visualize the results from ActiveData is to plot them on a chart. This can be achieved using a Jupyter Notebook, with pandas, NumPy, and matplotlib. If you have Docker installed then a really quick way to get started is to use the jupyter/datascience-notebook image:
$ docker run -it --rm -p 8888:8888 jupyter/datascience-notebook
[I 17:58:11.744 NotebookApp] Writing notebook server cookie secret to /home/jovyan/.local/share/jupyter/runtime/notebook_cookie_secret
[W 17:58:12.747 NotebookApp] WARNING: The notebook server is listening on all IP addresses and not using encryption. This is not recommended.
[I 17:58:12.814 NotebookApp] Serving notebooks from local directory: /home/jovyan/work
[I 17:58:12.814 NotebookApp] 0 active kernels
[I 17:58:12.814 NotebookApp] The Jupyter Notebook is running at: http://[all ip addresses on your system]:8888/?token=[TOKEN]
[I 17:58:12.814 NotebookApp] Use Control-C to stop this server and shut down all kernels (twice to skip confirmation).
[C 17:58:12.824 NotebookApp]

    Copy/paste this URL into your browser when you connect for the first time,
    to login with a token:
        http://localhost:8888/?token=[TOKEN]
Open Jupyter at the URL provided and create a new Notebook with your preferred Python version.
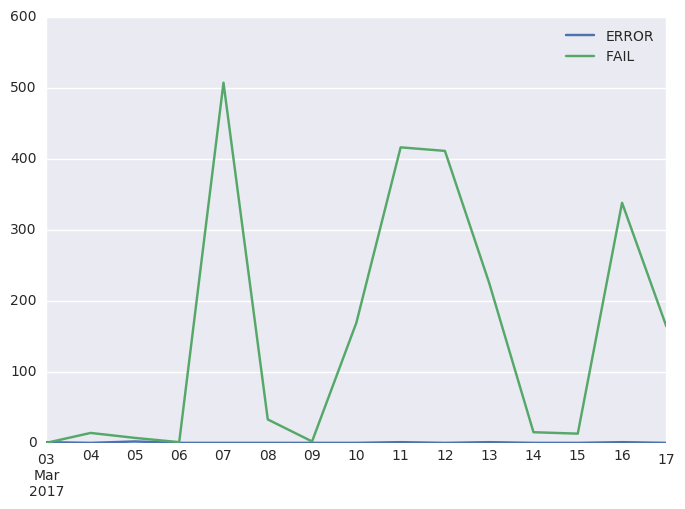
In the first cell, build your query. The following will return all failing tests run in the last two weeks by day and outcome, which will allow us to plot the outcomes on a chart:
query = """{
"from":"fx-test",
"edges":[
  {"value":"result.result","allowNulls":false},
  {
    "value":"result.end_time",
    "allowNulls":false,
    "domain":{
      "type":"time",
      "min":"today-2week",
      "max":"tomorrow",
      "interval":"day"
    }
  }
],
"where":{"and":[
  {"gte":{"result.end_time":{"date":"today-2week"}}},
  {"eq":{"result.ok":false}}
]},
"format":"cube",
"limit":1000
}"""
In the next cell, post the query and retrieve the JSON results:
import requests
data = requests.post('http://activedata.allizom.org/query', data=query).json()
Now we import NumPy and Pandas, and build a DataFrame with a series for each outcome:
import numpy as np
import pandas as pd

d = {}
i = np.array([d['min'] for d in data['edges'][1]['domain']['partitions']]).astype('datetime64[s]')
for idx, val in enumerate(data['data']['count']):
    result = data['edges'][0]['domain']['partitions'][idx]['value']
    d[result] = pd.Series(val, index=i)
df = pd.DataFrame(d)
Finally, we import Seaborn (for more attractive charts) and plot our line chart:
import seaborn as sns
sns.set_style('darkgrid')
df.plot.line()
The chart will be displayed in the Jupyter Notebook. It’s now pretty easy to tweak the query and DataFrame, or try different types of charts.
Known Limitations
Unfortunately, mozlog does not currently support Python 3. This means that any suite that produces structured logs for consumption by ActiveData is required to run on legacy Python.